
C957 Applied Algebra (FXO2)
Correct answers are highlighted in green. Graph screenshots from the chat are included under their questions.
Question 1
The value of a collectible coin over time is modeled by V(t), whose graph is shown. How is the value of the coin changing over time based on the graph?

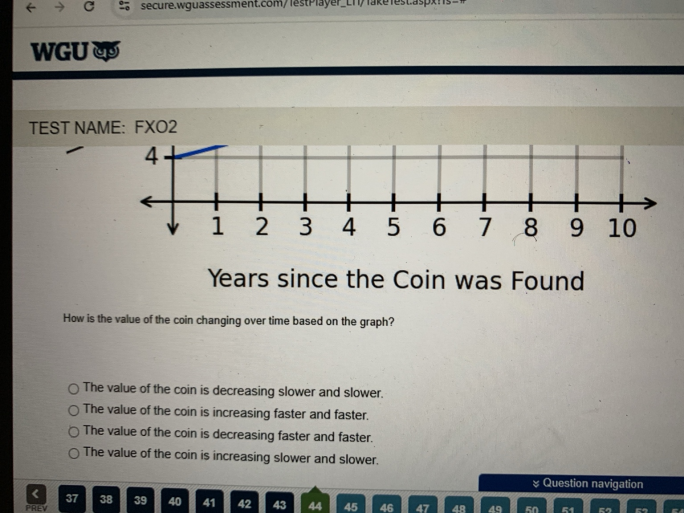
A. The value of the coin is decreasing slower and slower.
B. The value of the coin is increasing faster and faster.
C. The value of the coin is decreasing faster and faster.
D. The value of the coin is increasing slower and slower.
Correct Answer: B
Question 2
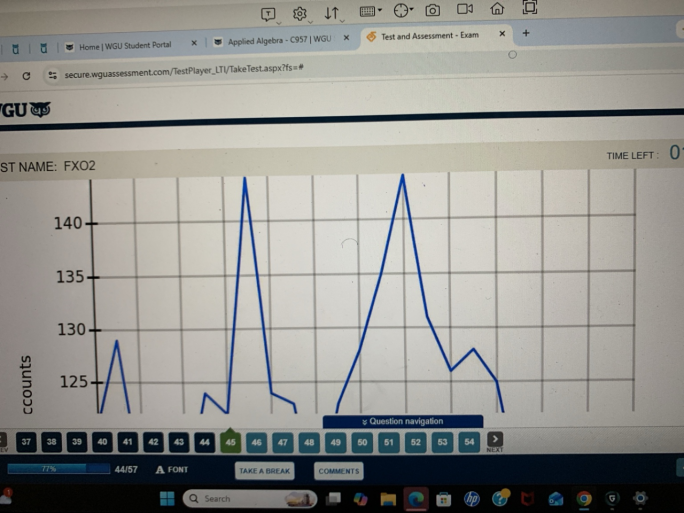
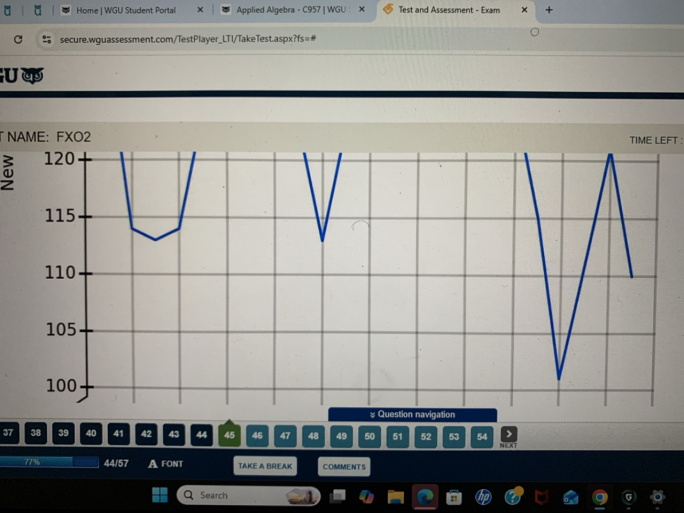
More customer accounts are opened during snowy weeks than during weeks without snow. When was it likely snowy?
A. It was likely snowy during only week 1.
B. It was likely snowy during only week 7.
C. It was likely snowy during weeks 1 and 5.
D. It was likely snowy during weeks 7 and 14.
Correct Answer: D
Question 3
Which conclusion about the information in the graph is accurate?
A. The maximum number of boats passing under the bridge per hour is 43 and occurs at hour 1.
B. The minimum number of boats passing under the bridge per hour is 30 and occurs at hour 5.
C. The minimum number of boats passing under the bridge per hour is 38 and occurs at hour 3.
D. The maximum number of boats passing under the bridge per hour is 24 and occurs at hour 7.
Correct Answer: A
Question 4
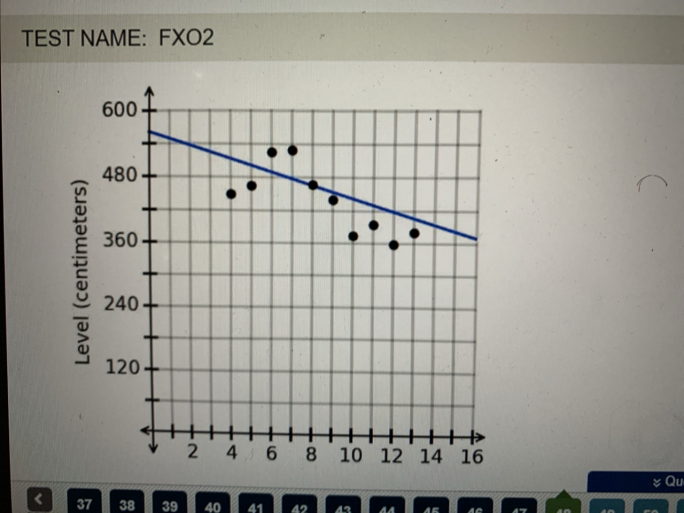
Is it appropriate to make a prediction for the water level after 15.7 weeks?
A. Yes. The r-value indicates a moderate fit, and x = 15.7 is within 25% of the range of the maximum value.
B. No. The r-value indicates a moderate fit, but x = 15.7 is more than 25% of the range beyond the maximum value.
C. Yes. The r-value indicates a strong fit, and x = 15.7 is within 50% of the range of the maximum value.
D. No. The r-value indicates a strong fit, but x = 15.7 is more than 50% of the range beyond the maximum value.
Correct Answer: B
Question 5
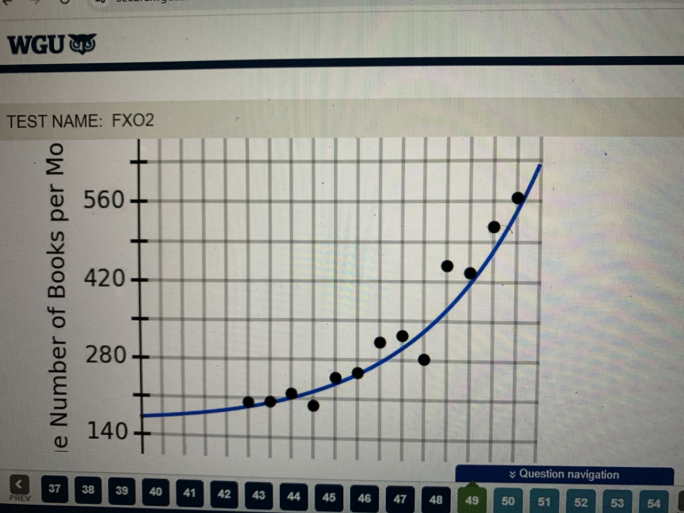
Which range of x-values is appropriate for extrapolation? (r = 0.92)
A. x = 2 to x = 20
B. x = -1 to x = 23
C. Extrapolation is not appropriate because r < 1.
D. Extrapolation is not appropriate because r > 0.7.
Correct Answer: B
Question 6

Which range of x-values is appropriate for extrapolation? (r = 0.58)
A. x = 1 to x = 19
B. x = -2 to x = 22
C. Extrapolation is not appropriate because r² < 1.
D. Extrapolation is not appropriate because r² < 0.7.
Correct Answer: D
Question 7
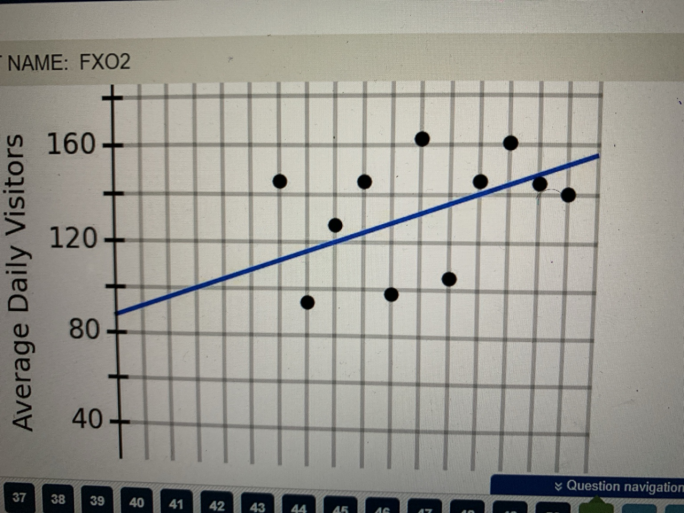
What is the appropriate range of x-values for extrapolation? (r = 0.08)
A. x = 1 to x = 21
B. x = 3.5 to x = 18.5
C. Extrapolation is not appropriate because r < 0.3.
D. Extrapolation is not appropriate because r < 0.7.
Correct Answer: C
Question 8
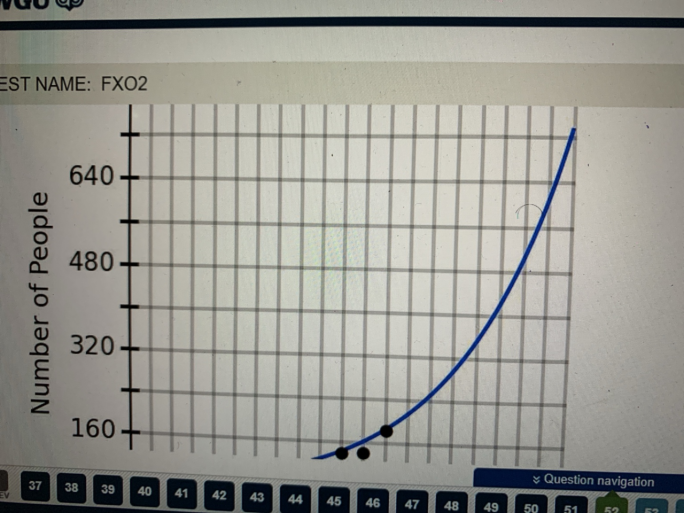
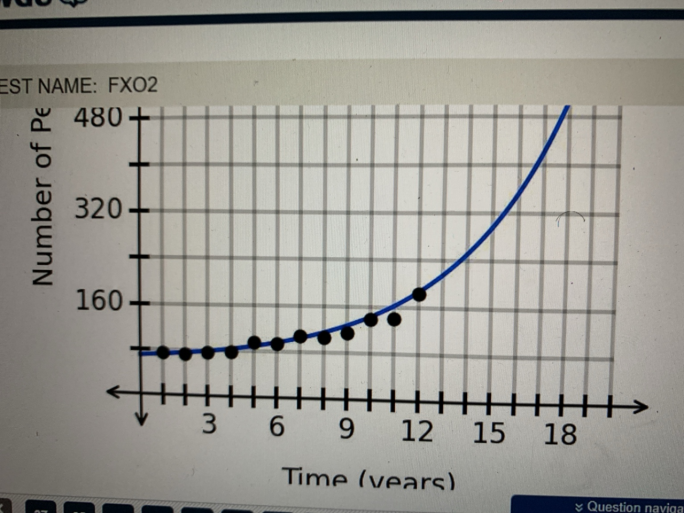
Is this prediction appropriate? The regression function has r² = 0.93 and predicts 623.4 people after 19.1 years.
A. Yes. The r² value indicates a moderate fit, and x = 19.1 is within 25% of the range of the maximum value.
B. Yes. The r² value indicates a strong fit, and x = 19.1 is within 50% of the range of the maximum value.
C. No. The r² value indicates a strong fit, but x = 19.1 is more than 50% of the range beyond the maximum value.
D. No. The r² value indicates a moderate fit, but x = 19.1 is more than 25% of the range beyond the maximum value.
Correct Answer: B
Question 9

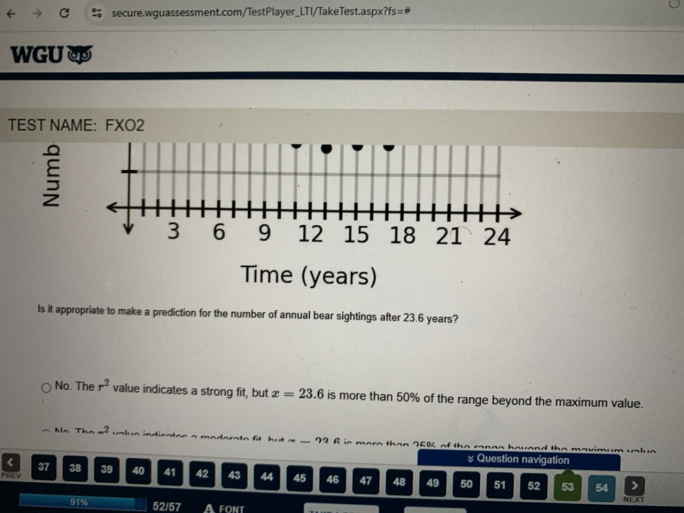
Is it appropriate to make a prediction for the number of annual bear sightings after 23.6 years? (r² = 0.37)
A. No. The r² value indicates a strong fit, but x = 23.6 is more than 50% of the range beyond the maximum value.
B. No. The r² value indicates a moderate fit, but x = 23.6 is more than 25% of the range beyond the maximum value.
C. Yes. The r² value indicates a moderate fit, and x = 23.6 is within 25% of the range of the maximum value.
D. Yes. The r² value indicates a strong fit, and x = 23.6 is within 50% of the range of the maximum value.
Correct Answer: B
Question 10
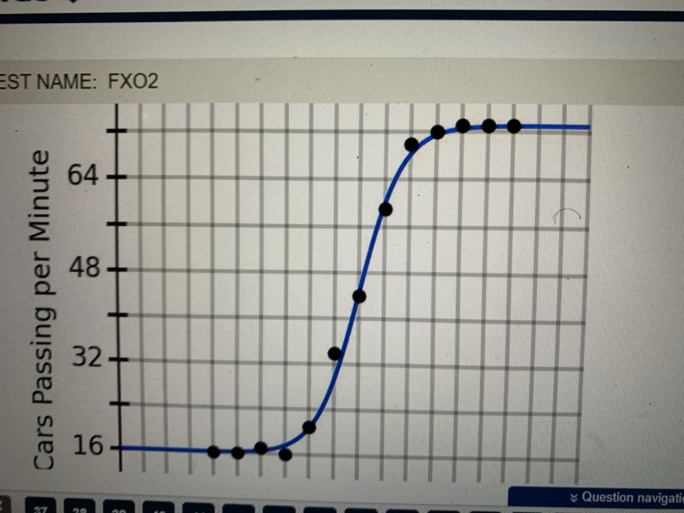
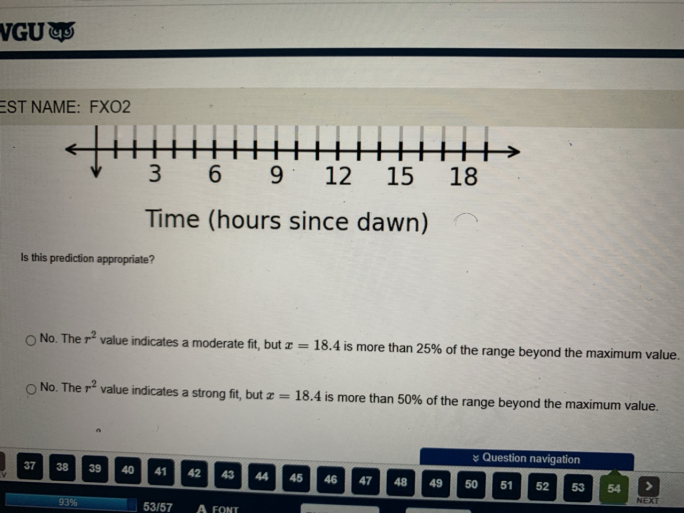
Is this traffic prediction appropriate? The regression function has r² = 1.0 and predicts 73 cars per minute after 18.4 hours.
A. No. The r² value indicates a moderate fit, but x = 18.4 is more than 25% of the range beyond the maximum value.
B. No. The r² value indicates a strong fit, but x = 18.4 is more than 50% of the range beyond the maximum value.
C. Yes. The r² value indicates a strong fit, and x = 18.4 is within 50% of the range of the maximum value.
Correct Answer: C

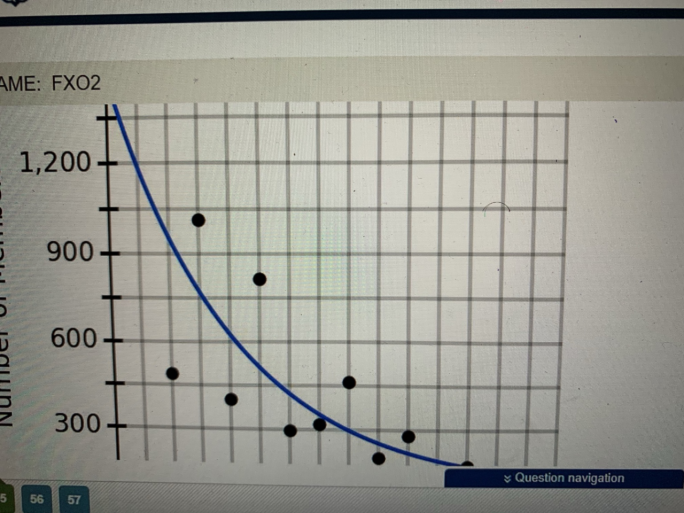

Is it appropriate to make a prediction for the number of members after 14.1 years? (r² = 0.44)
A. Yes. The r² value indicates a strong fit, and x = 14.1 is within 50% of the range of the maximum value.
B. Yes. The r² value indicates a moderate fit, and x = 14.1 is within 25% of the range of the maximum value.
C. No. The r² value indicates a moderate fit, but x = 14.1 is more than 25% of the range beyond the maximum value.
D. No. The r² value indicates a strong fit, but x = 14.1 is more than 50% of the range beyond the maximum value.
Correct Answer: B
Don’t struggle with passing your Aplied Algebra (FXO2) am here to help you pass and also get the exact questions .Just reach out it us and will help you pass your exam by the first attempt.Students place their trust in exam experts who prioritize reliability, integrity, and measurable results. Through continuous support, transparent processes, and a strong success record, ProctoredExamsExperts.com empowers learners to perform at their best while enjoying complete peace of mind.
Related Posts
D391 WGU Healthcare Ecosystem Exam (VSC1)
-
Posted by
proct
HPO1 Employment and Labor Law
-
Posted by
WGU D311 GMO1 :Microbiology with lab:A fundamental approach
-
Posted by
WGU D391 Healthcare Ecosystem Exam (VSC1)
-
Posted by
WGU C202 Managing human capital (UXC2 Latest ) questions
-
Posted by
Applied Probability and Statistics C955 (MQO1)
-
Posted by
WGU C237 Taxation 1 (NDC1)
-
Posted by
WGU C722 Project management (IPO1) Exam with answers
-
Posted by
WGU Advanced Pathophysiology ( D115) exam latest (PCC2)
-
Posted by
WGU C202 Managing human capital (UXC2) Latest
-
Posted by
WGU D391 Healthcare Ecosystems (VSC1) Exam questions with answers
-
Posted by
WGU C722 Operations Management (IPO1) Exam with answers
-
Posted by